Finding activity on the ham radio bands used to mean tuning around the dial and listening for QSOs, one frequency at a time. We were blind to anything but the frequency we were on. But now, a useful display tool is appearing on current model radios. Whether you call it a waterfall, band scope, or panadapter, this modern display can show you an overview of the signals present on any radio band.
With waterfall displays, you can instantly tell whether anyone is around. Being able to locate ham radio signals means that you can move quickly to the frequency and give them a call. On some radios, it can be as simple as touching the screen or a mouse click—no need to touch the VFO knob.
The technology has been around for more than 90 years. Panoramic reception was created by a French engineer and ham, Marcell Wallace, F3HM. His panadapter made RF signals visible on a CRT and they could be identified by mode. Early versions like the RBY-1 US Navy Panoramic Radio Adapter were paired with the Hallicrafters SX-28 during WWII.
What is the Waterfall?
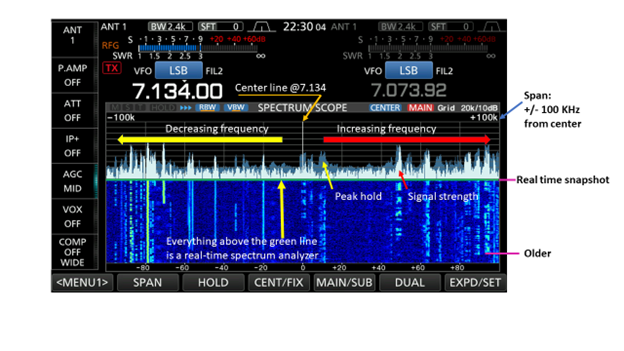
A radio waterfall display is a graphical representation of a radio signal. It provides a way of visualizing the frequency content of a signal over time and can help radio operators in identifying and analyzing signals easily. On the Icom IC-7610 transceiver, for example, you can select a small range of frequencies or the entire band by adjusting the span.
Typically, the waterfall display appears as a scrolling graph that shows frequency on the horizontal axis. Time can be found on the vertical axis and display speed can be adjusted using <MENU2> on the IC-7610. It features a series of vertical waterfall lines, each representing a snapshot of the signal’s spectrum at a specific moment in time. The most recent snapshot is located at the top of the display, while older snapshots are displayed below it in chronological order.
The default on the IC-7610 is for the centerline to be in the center of the band of the signal, matching the displayed frequency (7.134.00, on the main VFO). Note the numbers at the bottom of the display. The negative numbers moving right indicate decreasing frequency; the positive numbers moving left indicate increasing frequency (see below).
There’s a Message in Every Waterfall
By observing the display over time, an operator can see how the frequency content of the signal changes and can identify patterns in the signal. Starting from the top down, you’ll see the signal amplitude represented in white that is regularly changing. The grayed-out area behind this represents the ghost of signal peaks past, known as peak hold. This spectrum scope is useful for knowing what’s happening on the band this instant.
But there’s additional information the waterfall can tell us. Moving down the screen, look at the waterfall component. Instead of representing signal strength with a graph, you can translate that into a line. New lines are created at the top and then fall downward in real time, just as water does over a waterfall. Speed is adjustable. Sometimes you can find things in the waterfall that don’t show up well on the spectrum scope—maybe some rare DX!
As long as the line is visible, you have time to look back in time. The history shows where conversations have been taking place, and there’s a good chance more could appear as time goes by. This could be useful for finding contacts during contesting—or locating unused frequencies where you can move in and start calling CQ.
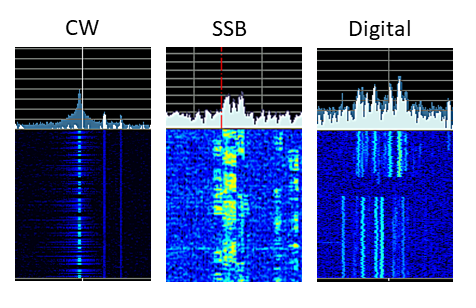
You’ll find spots of color with brighter colors on the lines indicating higher signal strength. Waterfall colors are under your control—press and hold the <EXPD/SET> soft button in <MENU1> and the scope set options appear. If you press the <SPAN> button, you can adjust the width of the line or signal trail. Voice modes such as AM and SSB will appear wider than those for digital or CW (see below).
Open spots in the waterfall trail represent several things. They might indicate varying modulation in a transmission, the station got weaker, or it’s a break as the conversation is turned over to another station.
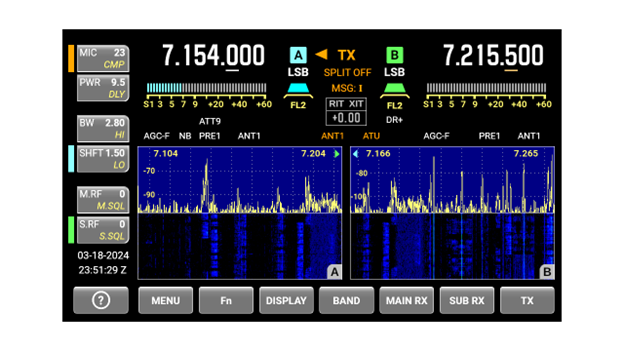
Two can be better than one. There’s a dual panadapter mode that lets you monitor activity on VFO A and VFO B. The example below is from an Elecraft K4D.
Better yet, your radio doesn’t need to have a built-in waterfall display to take advantage of its features. If you’re a digital user, free programs like Fldigi and WSJT-X have built-in waterfall displays to help you navigate the tightly packed signals. Older radios without the waterfall can be used—your computer handles the display.
3DSS—Another Dimension
Yaesu FTXD101 and FTDX10 transceivers offer a 3DSS version of the waterfall. It adds depth to the two-dimensional waterfall. It reminds me of watching an armada of toy sailboats (representing the signal) slowly floating on the Niagara River toward the Falls, then plummeting out of sight.
At lower frequency spans, I’ve found 3DSS is a good way to visualize how much space a signal is taking up and where the peaks are over time. The width and color intensity found on the standard waterfall appear, but it’s a different and perhaps more convenient way to visualize it. Turn down the signal level so the spikes look like individual blades of grass—this will maximize the view of signals (see below).
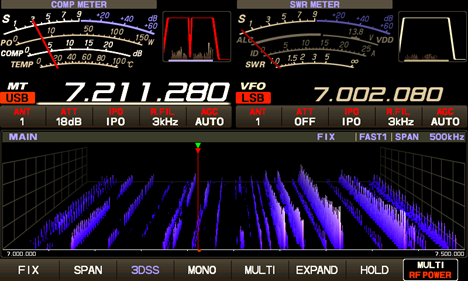
When there are static crashes, the 3DSS image creates a tall “wall” that makes it hard to see the signals before and after the static crash. Even if you attenuate the level of incoming signals, it still makes the 3D waterfall a challenge to use. That’s when to switch back to the standard waterfall.
Hello? Is There Anybody Out There?
The waterfall display can provide a visual representation of complex signals over time, making it a valuable tool for a wide range of applications. You can look for activity on the air, determine the operating mode, and determine signal strength by the clarity and color of the vertical signal trail.